
Entering into the weekend series with Arizona, the Tigers offense had scored 3.91 R/G, which has them as the 9th lowest scoring offense and .40 R/G below the league average. They’ve been shutout 5 times on the season, included the last two games. They scored 6 runs in their last 3 versus a team that has given up a league high 5.56 R/G. Yes, they scored a slight more runs in 3 games against a team that gives that up per game. But we all know this. We’ve seen it for the last 43 games. The occasional breakout game where they look like they’re ready to go. Let’s see if we can dig in to see some data points and what they say.
Contact data
One thing I was curious about was some of the contact data that’s out there. Baseball Savant has some wonder data on that, where they separate it out in a few different categories. If you’re unfamiliar with them, here’s a quick overview of what I’ve used:
Barrel: collection of BIP that are hit in the air, have an EV 95+, batting average of .500 and SLG 1.500
Solid: meets most of what a Barrel is, but is missing one or more of the characteristics of a Barrel and falls just short
Flares/Burners: Actually two different balls that are combined for simplicity. Is either a hard hit ball on the ground or has a lower EV and higher launch angle
Poor/Under: for the most part are pop-ups. Balls that have high launch angles and frequently result in an out.
Poor/Topped: balls hit right to the ground. Think negative launch angle.
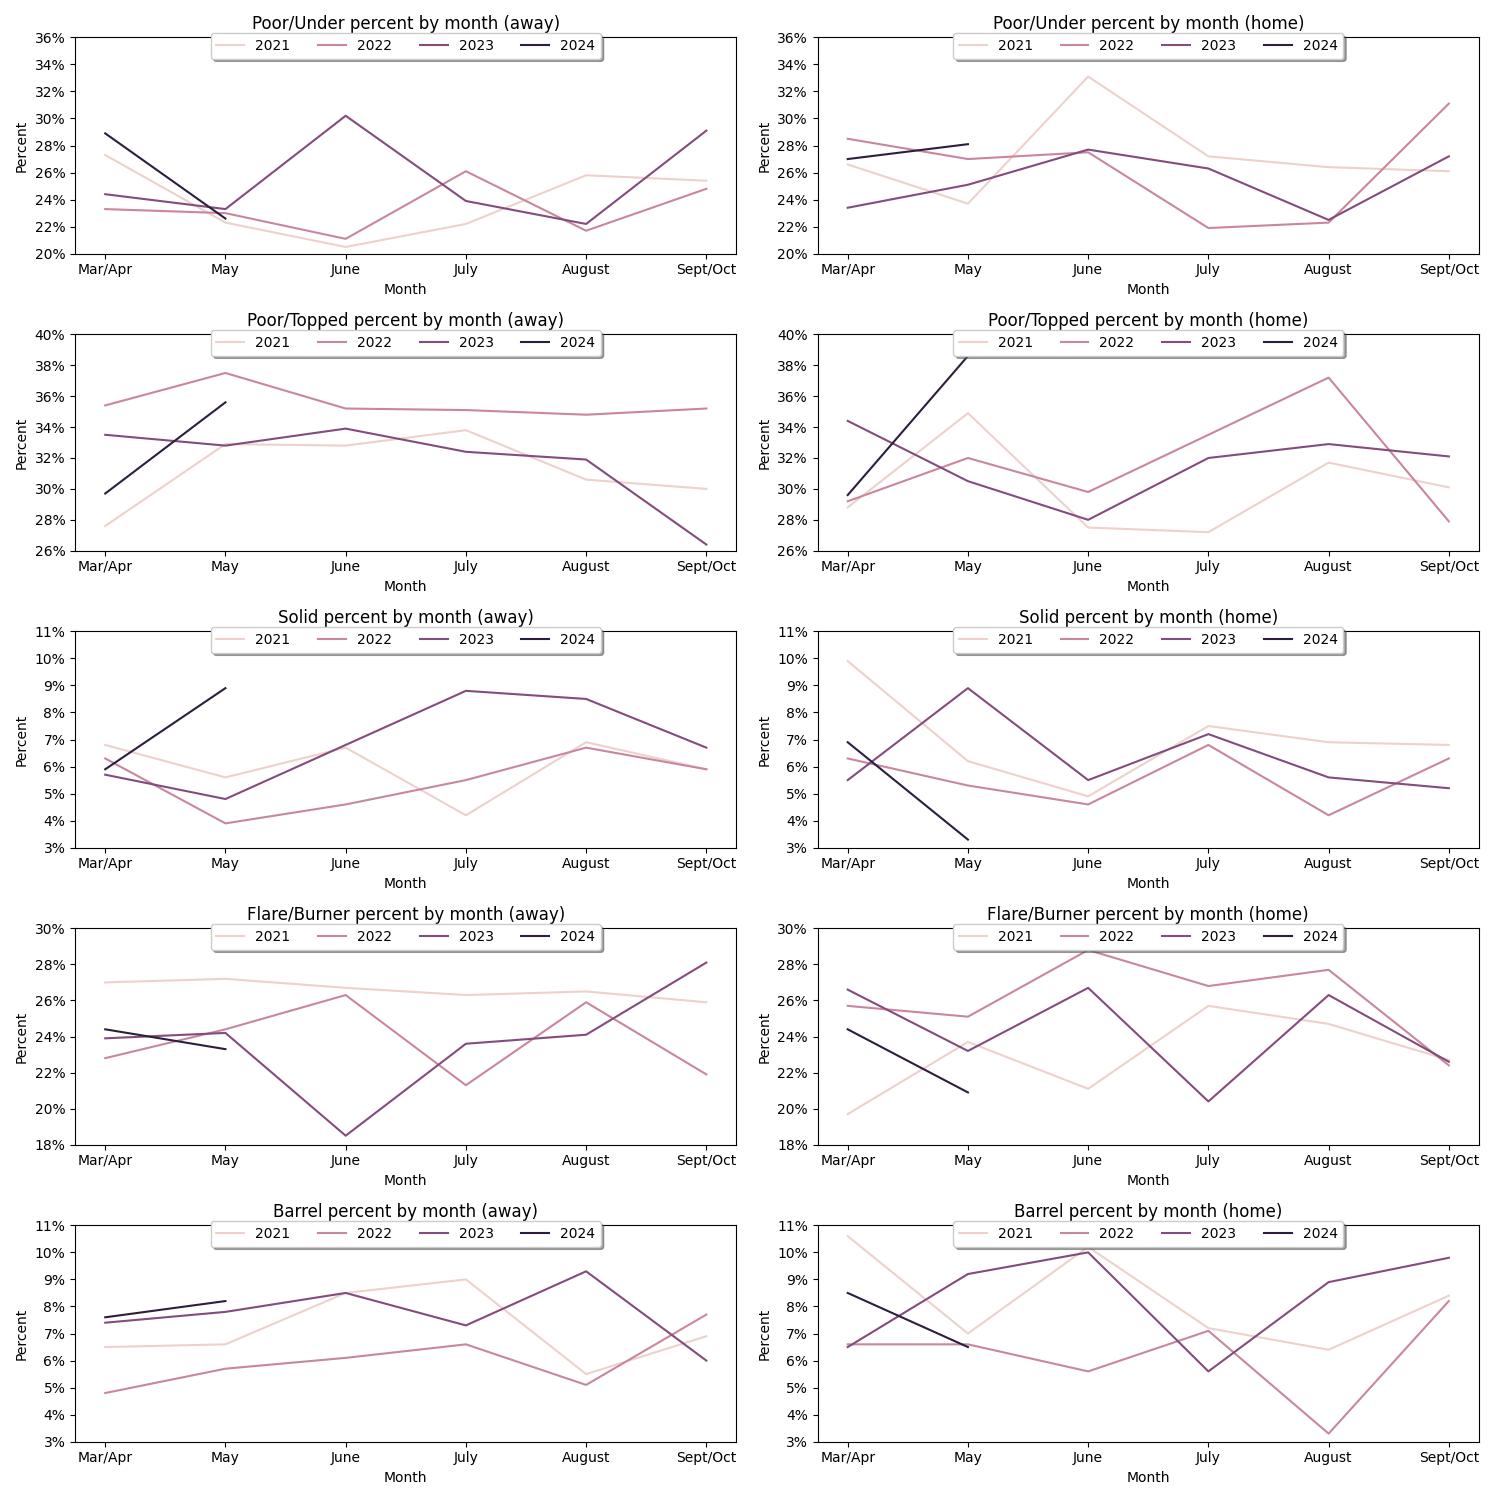
What I was curious about here was how did this year’s team compare to the Tigers over the last few years, more specifically the A.J. Hinch era. I also wanted to see how they did month-by-month to see if, truly, this has been a terrible stretch for them. And here’s what we have:

Interesting data. Thus far, halfway through May they are having their worst May at home, and you could argue one of their worst months at home since the 2021 season. On the flip side, they are having their best May on the road and, again, you could argue one of their best road months since 2021.
Let’s start with the home data. They went the opposite direction for every category from March/April. They’ve hit the ball weaker both on the ground and popped up compared to the previous month data, and saw pretty significant drops in their Solid contact and barrels. So much for home field advantage
Team swing metrics
This made me wonder whether it was possible that the players were changing their swing on the road vs at home. Let’s take a look at that. First, here’s a plot with the individual bat speeds on the road and at home, as well as individual swing length on the road and at home. Each plot is color coded by the difference of the home vs away data for the given plot.

More guys have less average bat speed on the road vs at home, even if just a little bit, whereas the swing length has remained fairly close to even between more and less. So with that, let’s also take a look at the density plots for all swings.


That shows some slight variance in there, but not at a lot. For the most part they fit close together. Where it gets more interesting, I think, is looking at the player data here vs the team.
Player swing metrics
As an example, here’s Mark Canha’s breakdown in average data at home vs away:
Mark Canha home: 67.2 MPH, 7.1 ft
Mark Canha away: 68.6 MPH, 7.1 ft
And now all of his individual swings similar to the plots above:


The average swing length is the same, but the distribution has changed. And it’s led to 22 more points to his slugging and 42 more points to his ISO. And he’s far from alone to see a fairly large separation of swing length or bat speed home and away. Riley Greene has a similar discrepancy to go with 30 points more slugging and a whopping 59 more points for his ISO on the road.
I’m not sure if that’s the cause of better batted ball data away vs home, but it is something I think we should keep an eye on.
Conclusion
I did not say anything shocking when I referenced the poor offensive numbers at the beginning. We’ve all seen it. What might be surprising is how those struggles have happened. With the new swing metrics, I wonder if we might find a better answer in there as well or if it’s all just random variance that happens to be there. Regardless, hopefully the offense gets good on a more consistent basis.