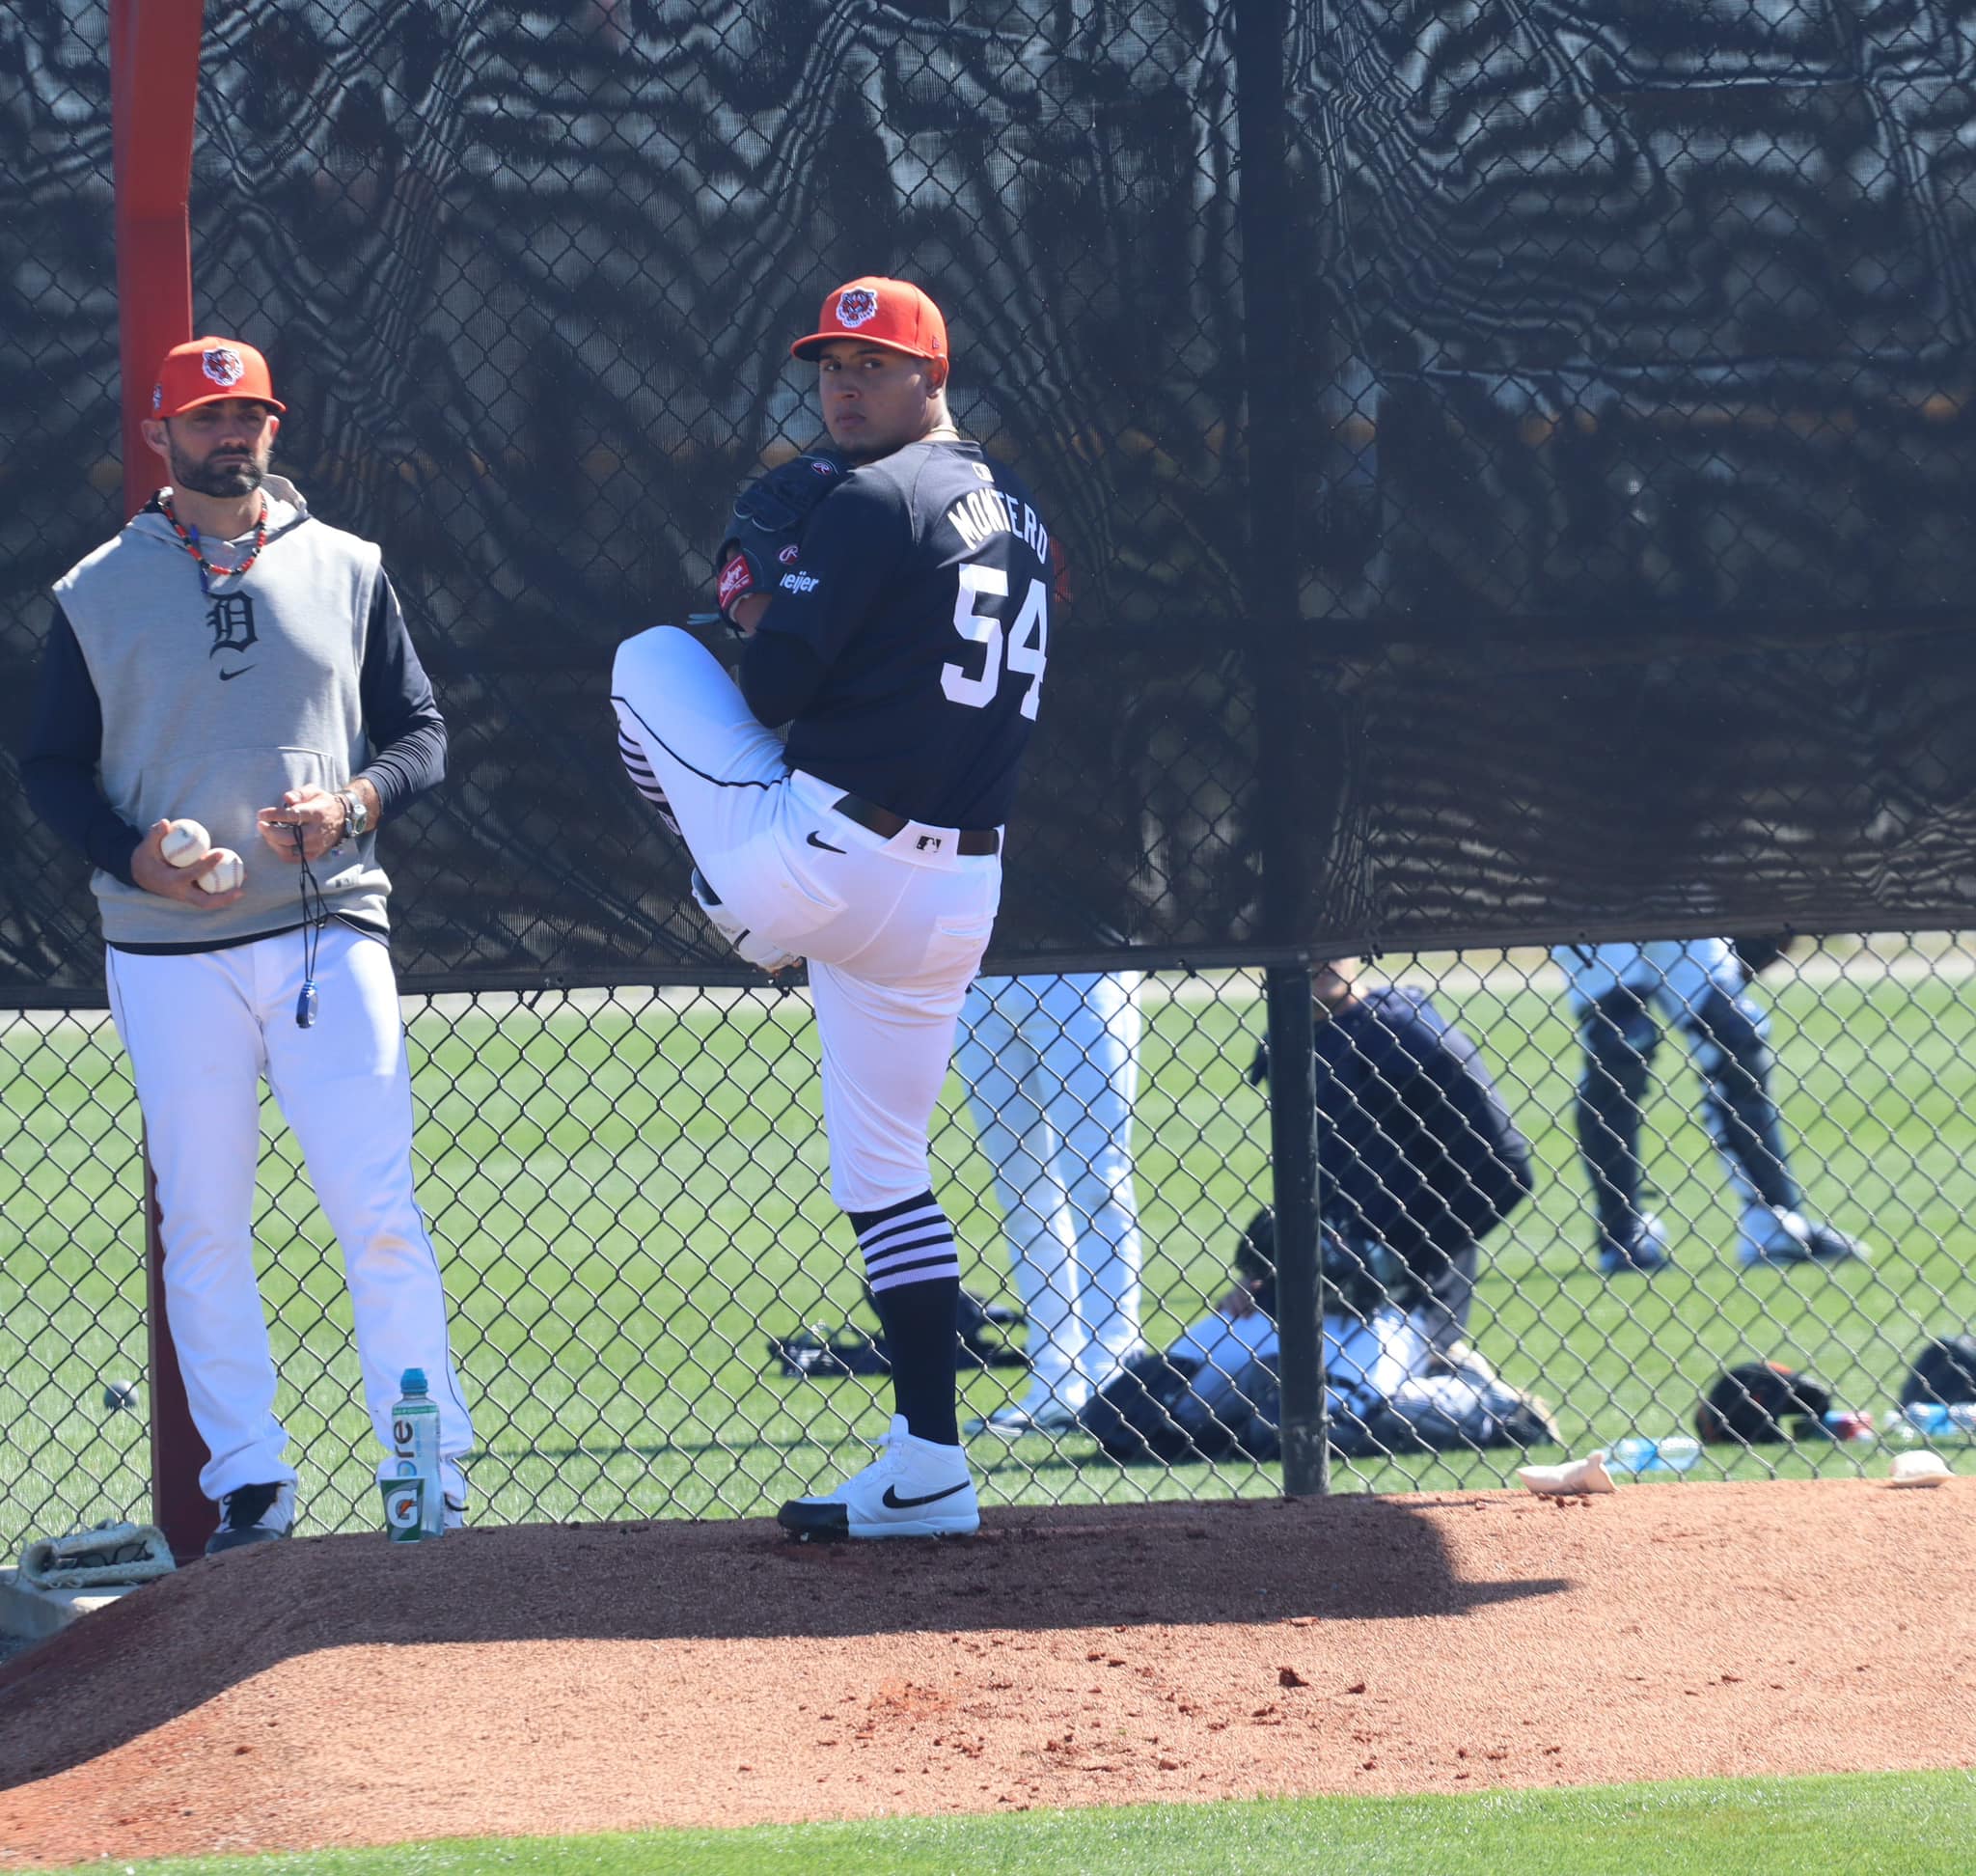
Keider Montero had his best appearance as a big leaguer on July 3rd. He saw his ERA drop from 9.35 to 6.60 while nearly matching his IP total from his previous two appearances. It’s the first time this year he’s pitched more than five innings in a game, and it’s the first time he’s made it longer than six IP in his entire career. He even did so on just 80 pitches. Very successful! But I wanted to check out some data on him.
Some Keider Montero Numbers
Despite the successful start, his strikeouts were down pretty significantly. His 14.8% K% was by far the lowest in his three big-league appearances. But that’s not too concerning for me. All pitchers have games like that. And that is a large part of the difference between his ERA and FIP for this game for him. He was able to manage to keep his BB% low and HRs low, at least compared to his other two games. But let’s look specifically at his fastball and how it was compared to his previous two outings.
|
Game |
% of pitches |
Whiff% |
RV/100 |
|
5/29 |
48.3% |
13.0% |
-1.2 |
|
6/26 |
39.4% |
28.6% |
-4.8 |
|
7/3 |
43.8% |
0.0% |
2.1 |
*RV/100 is run value per 100 pitches. Higher is better.
The first thing that stands out is that non-existent Whiff% in this last game, followed up immediately by the very good RV/100. How does a player get such a high RV/100 on a pitch that generated zero whiffs? That’s because RV/100 doesn’t care about whiffs. All it cares about is who that pitch benefitted more. If you’re curious about how it’s calculated, this is a very simple explanation of it:
Every count, out, and base state (empty, loaded, man on first, etc.) has a run value associated with it. Similar to RE24 (this uses RE288 thanks to different counts), RV/100 calculates how many runs have scored for each base/count/out combination. So it doesn’t matter how the outcome comes to be, it will benefit the hitters or pitcher. In this case, Montero managed to improve the outcome when he used his fastball significantly better than he did his previous two outings.
Plots!
How did he do that? Let’s look at where he placed his fastballs, broken down by start:

One thing he did not do was avoid the heart of the plate. By my count, 11 of his 35 fastballs touched the heart of the plate in some capacity. For me at least, nothing stands out as far as his location. What about when he threw it? Taking sequencing out right now, he threw far fewer of his FB when he was behind in the count and instead relied on his other pitches to get him back in, he also threw more of them to start a hitter than previously. He started with a fastball on 13 of the 27 batters he faced, which was slightly more than his previous outing.
But let’s look at these release points as well:


This, too, is very interesting to me. It’s not the first time I have written about a release point change for a pitcher’s fastball. That’s additional extension and a higher arm slot that we can see here. That alone would cause the hitter to see it differently. Added extension, which would move him past the league average for the fastball, means he’s not only releasing the ball closer to home plate, but he’s also capable of generating additional perceived velocity, giving the hitter less time to react and figure out what pitch it is. And it becomes even more complicated if the release point more closely matches his incredible secondary pitches.
Conclusion
I will continue to watch Montero’s release points and fastball performance to see how they evolve. I’m sure it’s only the beginning of modifications that will be made. Hopefully soon we will see some whiffs come along with the other results we have already seen so far. I had thoughts and hopes that he would be able to take the Reese Olson road, and this here is what I wanted to see.

