

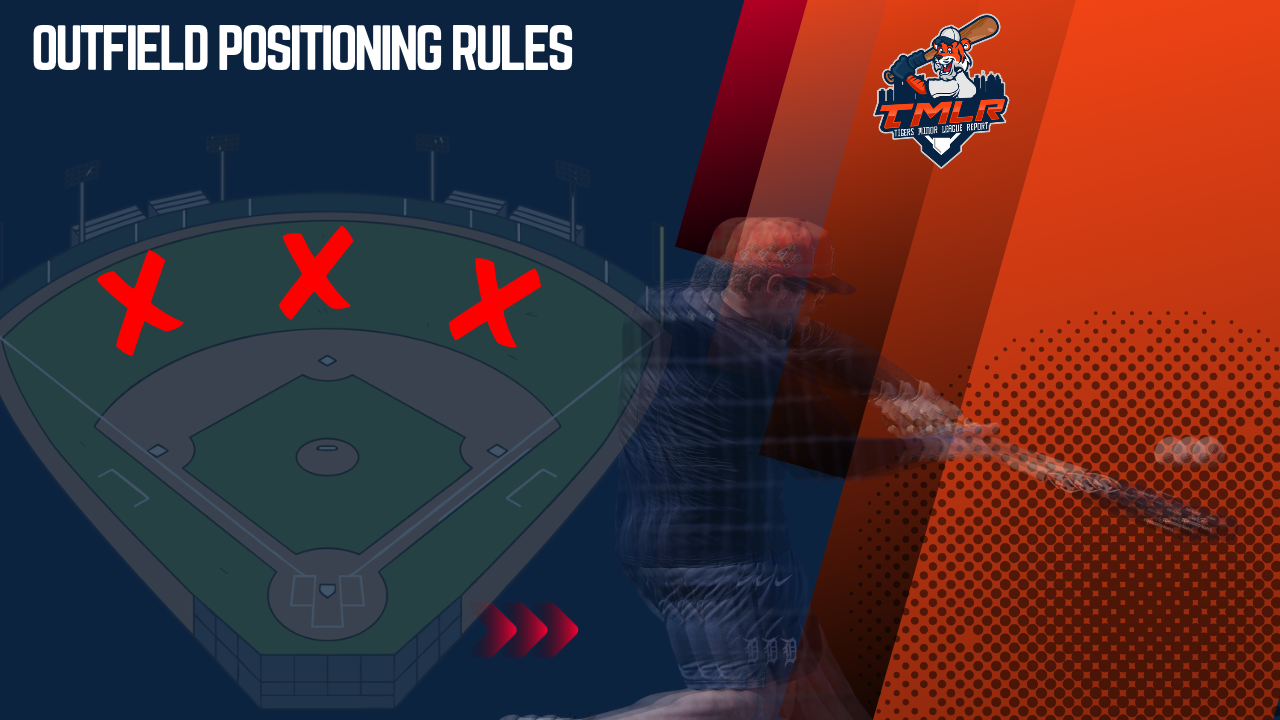
This is my first attempt at this kind of analysis. When I read about the Arizona Fall League’s outfield positioning experiment, I thought about all those moments during a Tigers game when a ball headed toward the gap ended up in an outfielder’s glove. What might have happened if this rule had been in effect this season?
That question became the starting point for this two-part series. This isn’t an exact science, and the numbers can’t tell us for certain which outs would have become hits. My goal is to explore what the data can tell us, explain how I reached my conclusions and make a complicated topic easier to understand. It’s also the kind of work I hope to do more of as I continue learning as I would need to see more video with this.
An outfielder’s starting position influences how much ground he needs to cover. MLB is testing whether limiting that positioning advantage can put more extra-base hits back into the game, with an experiment at Salt River Fields in the Arizona Fall League.
Josh Norris and JJ Cooper explained the experiment in their Oct. 7 Baseball America article, following Eric Longenhagen’s initial report for FanGraphs. The restrictions apply to where outfielders start when a pitch is thrown. They can still pursue the ball normally after contact.
Longenhagen observed corner outfielders positioned closer to the foul lines and an outfield alignment that was shallower than typically seen in the majors. Those starting points change the ground defenders must cover, potentially giving hitters more room between the outfielders or beyond them.
Hawk-Eye monitors compliance, while visual indicators tell defenders whether they are inside the permitted area. Under the reported enforcement system, a violation triggers a penalty when the improperly positioned player fields the ball. Umpires then determine where to place runners. Every positioning violation does not automatically award the batter a double.
As Norris and Cooper reported, MLB wants to see whether the restrictions encourage doubles, triples and more decisions on the bases. Their reporting describes how deeper outfield positioning and increasingly precise scouting information have helped defenses limit extra-base hits. The experiment attempts to change the conditions under which those plays develop.
Consider a drive into right-center. A right fielder already shaded toward that alley might catch it without covering much ground. Give him a starting position closer to the line, and the route becomes longer. A ball over his head presents a different challenge if he also has to start shallower.
Neither example guarantees a hit. The ball’s hang time, the defender’s speed and his route still influence the outcome. Shallower positioning could also help outfielders catch soft hits that currently land in front of them, meaning the experiment could create extra-base opportunities while taking away some singles.
That makes it important to separate this test from a discussion about unusual defensive shifts. Baseball Savant’s “Standard” outfield designation does not mean every defender stands at the same depth or occupies a position that would satisfy the AFL restrictions. A defense can be classified as standard without giving the hitter much room to work with.
To explore the Tigers angle, I examined two Baseball Savant exports containing 2,241 Detroit line drives and fly balls from the 2026 regular season. Of those, 2,184 were classified as occurring against standard outfield alignments and 57 against strategic alignments. The sample covers those two categories, rather than every possible defensive arrangement or every ball Detroit put in play.
That distribution makes the standard group the larger source of plays to investigate. It does not establish that standard positioning was more effective, and the strategic sample is too small to support sweeping comparisons. It also cannot tell us which starting positions would be legal under a future MLB rule.
The experiment remains a limited test, not an adopted major league change. Its eventual value will depend on whether the new starting positions produce the intended action and how the league adjusts the restrictions. So with all that being said, let’s take a look.
Which Tigers could benefit? A closer look at the Statcast data
Dillon Dingler and Spencer Torkelson emerged near the top of my narrower screening of Tigers outs toward the outfield gaps. Kevin McGonigle led a broader version of the same exercise, while Zach McKinstry and Colt Keith also had substantial numbers of qualifying plays.
Those findings offer a starting point for evaluating MLB’s outfield positioning experiment. They do not mean Dingler would have gained 18 hits or that McGonigle lost 28 doubles to defensive positioning. The purpose was to identify existing outs that warrant examination under different starting-position rules.
As discussed in Part 1, the Arizona Fall League experiment restricts where outfielders can stand before a pitch. To explore which Tigers might benefit, I combined two Baseball Savant Statcast Search exports: 2,184 line drives and fly balls against standard outfield alignments and 57 against strategic alignments. The combined file contained 2,241 unique plays from March 26 through Sept. 27, 2026. I checked game, plate-appearance and pitch identifiers to ensure no play appeared twice.
From that sample, I selected outfield catches on balls hit at least 90 mph, with launch angles between 10 and 35 degrees and projected distances of at least 250 feet. Sacrifice flies and catches that led to double plays were included, with each batted ball counted once. The 90 mph threshold is my screening choice, not Statcast’s official hard-hit cutoff.
Next, I calculated each ball’s direction using the hc_x and hc_y spray-chart coordinates, following the conversion described in Analyzing Baseball Data with R. Those fields describe the ball’s location on the spray chart. They are not measurements of where an outfielder stood before the pitch.
The broader screen covered directions 10–35 degrees to either side of straightaway center. I then tightened those bands to 15–30 degrees to check how much the rankings depended on the boundaries. In plain terms, the second version focused on a smaller portion of each alley.
These are analytical definitions of areas toward the gaps. They do not reproduce the AFL’s allowed defensive positions, and they are not adjusted to each stadium’s dimensions. All boundary checks used unrounded angles.
| Tigers hitter | Qualifying outs, broader areas | Qualifying outs, narrower areas |
|---|---|---|
| Kevin McGonigle | 28 | 11 |
| Zach McKinstry | 25 | 14 |
| Colt Keith | 24 | 13 |
| Dillon Dingler | 23 | 18 |
| Spencer Torkelson | 21 | 16 |
| Matt Vierling | 18 | 10 |
| Riley Greene | 17 | 8 |
| Hao-Yu Lee | 15 | 7 |
| Gleyber Torres | 13 | 12 |
| Kerry Carpenter | 11 | 9 |
Source: Original calculations from the two Baseball Savant exports. The table shows the 10 leaders in the broader screen. These are qualifying outs, not estimates of additional hits.
Dingler led the narrower screen with 18 outs, followed by Torkelson with 16. Both retained most of their qualifying plays when the areas tightened, making them sensible starting points for a video review. These totals are not adjusted for playing time, so they describe the number of opportunities in the sample rather than each hitter’s likelihood of benefiting per plate appearance.
McGonigle led the broader screen with 28 outs, but only 11 remained in the narrower areas. That difference shows why it would be premature to declare a single winner. His potential benefit would depend on the exact positions MLB allows defenders to occupy and which parts of the outfield become harder to cover.
McKinstry and Keith finished with 25 and 24 outs in the broader screen, respectively. Greene had 17, despite producing some exceptionally firm contact. Keith’s Aug. 30 lineout to right, for example, was recorded at 108.3 mph with an 18-degree launch angle and a projected distance of 326 feet. Greene’s June 30 lineout to right came off the bat at 110.8 mph. Both are candidates for review, not proof that the defense took away a would-be double.
I also checked the alignment categories separately. Among all batted balls meeting the broader contact-and-location screen, including hits, the standard group contained 466 plays and the strategic group just 12. Removing home runs left 381 standard-alignment balls, of which 234 were caught, and 10 strategic-alignment balls, of which six were caught. Those catch shares were 61.4% and 60%, respectively.
The data gives us a starting point for understanding which Tigers might be affected by restrictions on outfield positioning. Dingler and Torkelson led the narrower screen of qualifying outs, while McGonigle, McKinstry and Keith stood out across the broader areas. Those differences also show how much the answer depends on which portions of the outfield become harder to defend.
These totals identify plays to examine, rather than additional hits to award. An outfielder’s starting position is one part of a catch, along with his range, route and the time the ball stays in the air. Different positioning could allow some drives to fall while helping defenders reach other balls that currently become hits.
I started this project wondering how a rule being tested in Arizona might have changed moments from the Tigers’ season. This first look provides a group of hitters and plays to follow as the experiment develops. For now, it helps connect the proposed change to something familiar: a ball headed toward the alley and whether an outfielder can get there.
 Tristen Kuhn
 Colin Arthur