
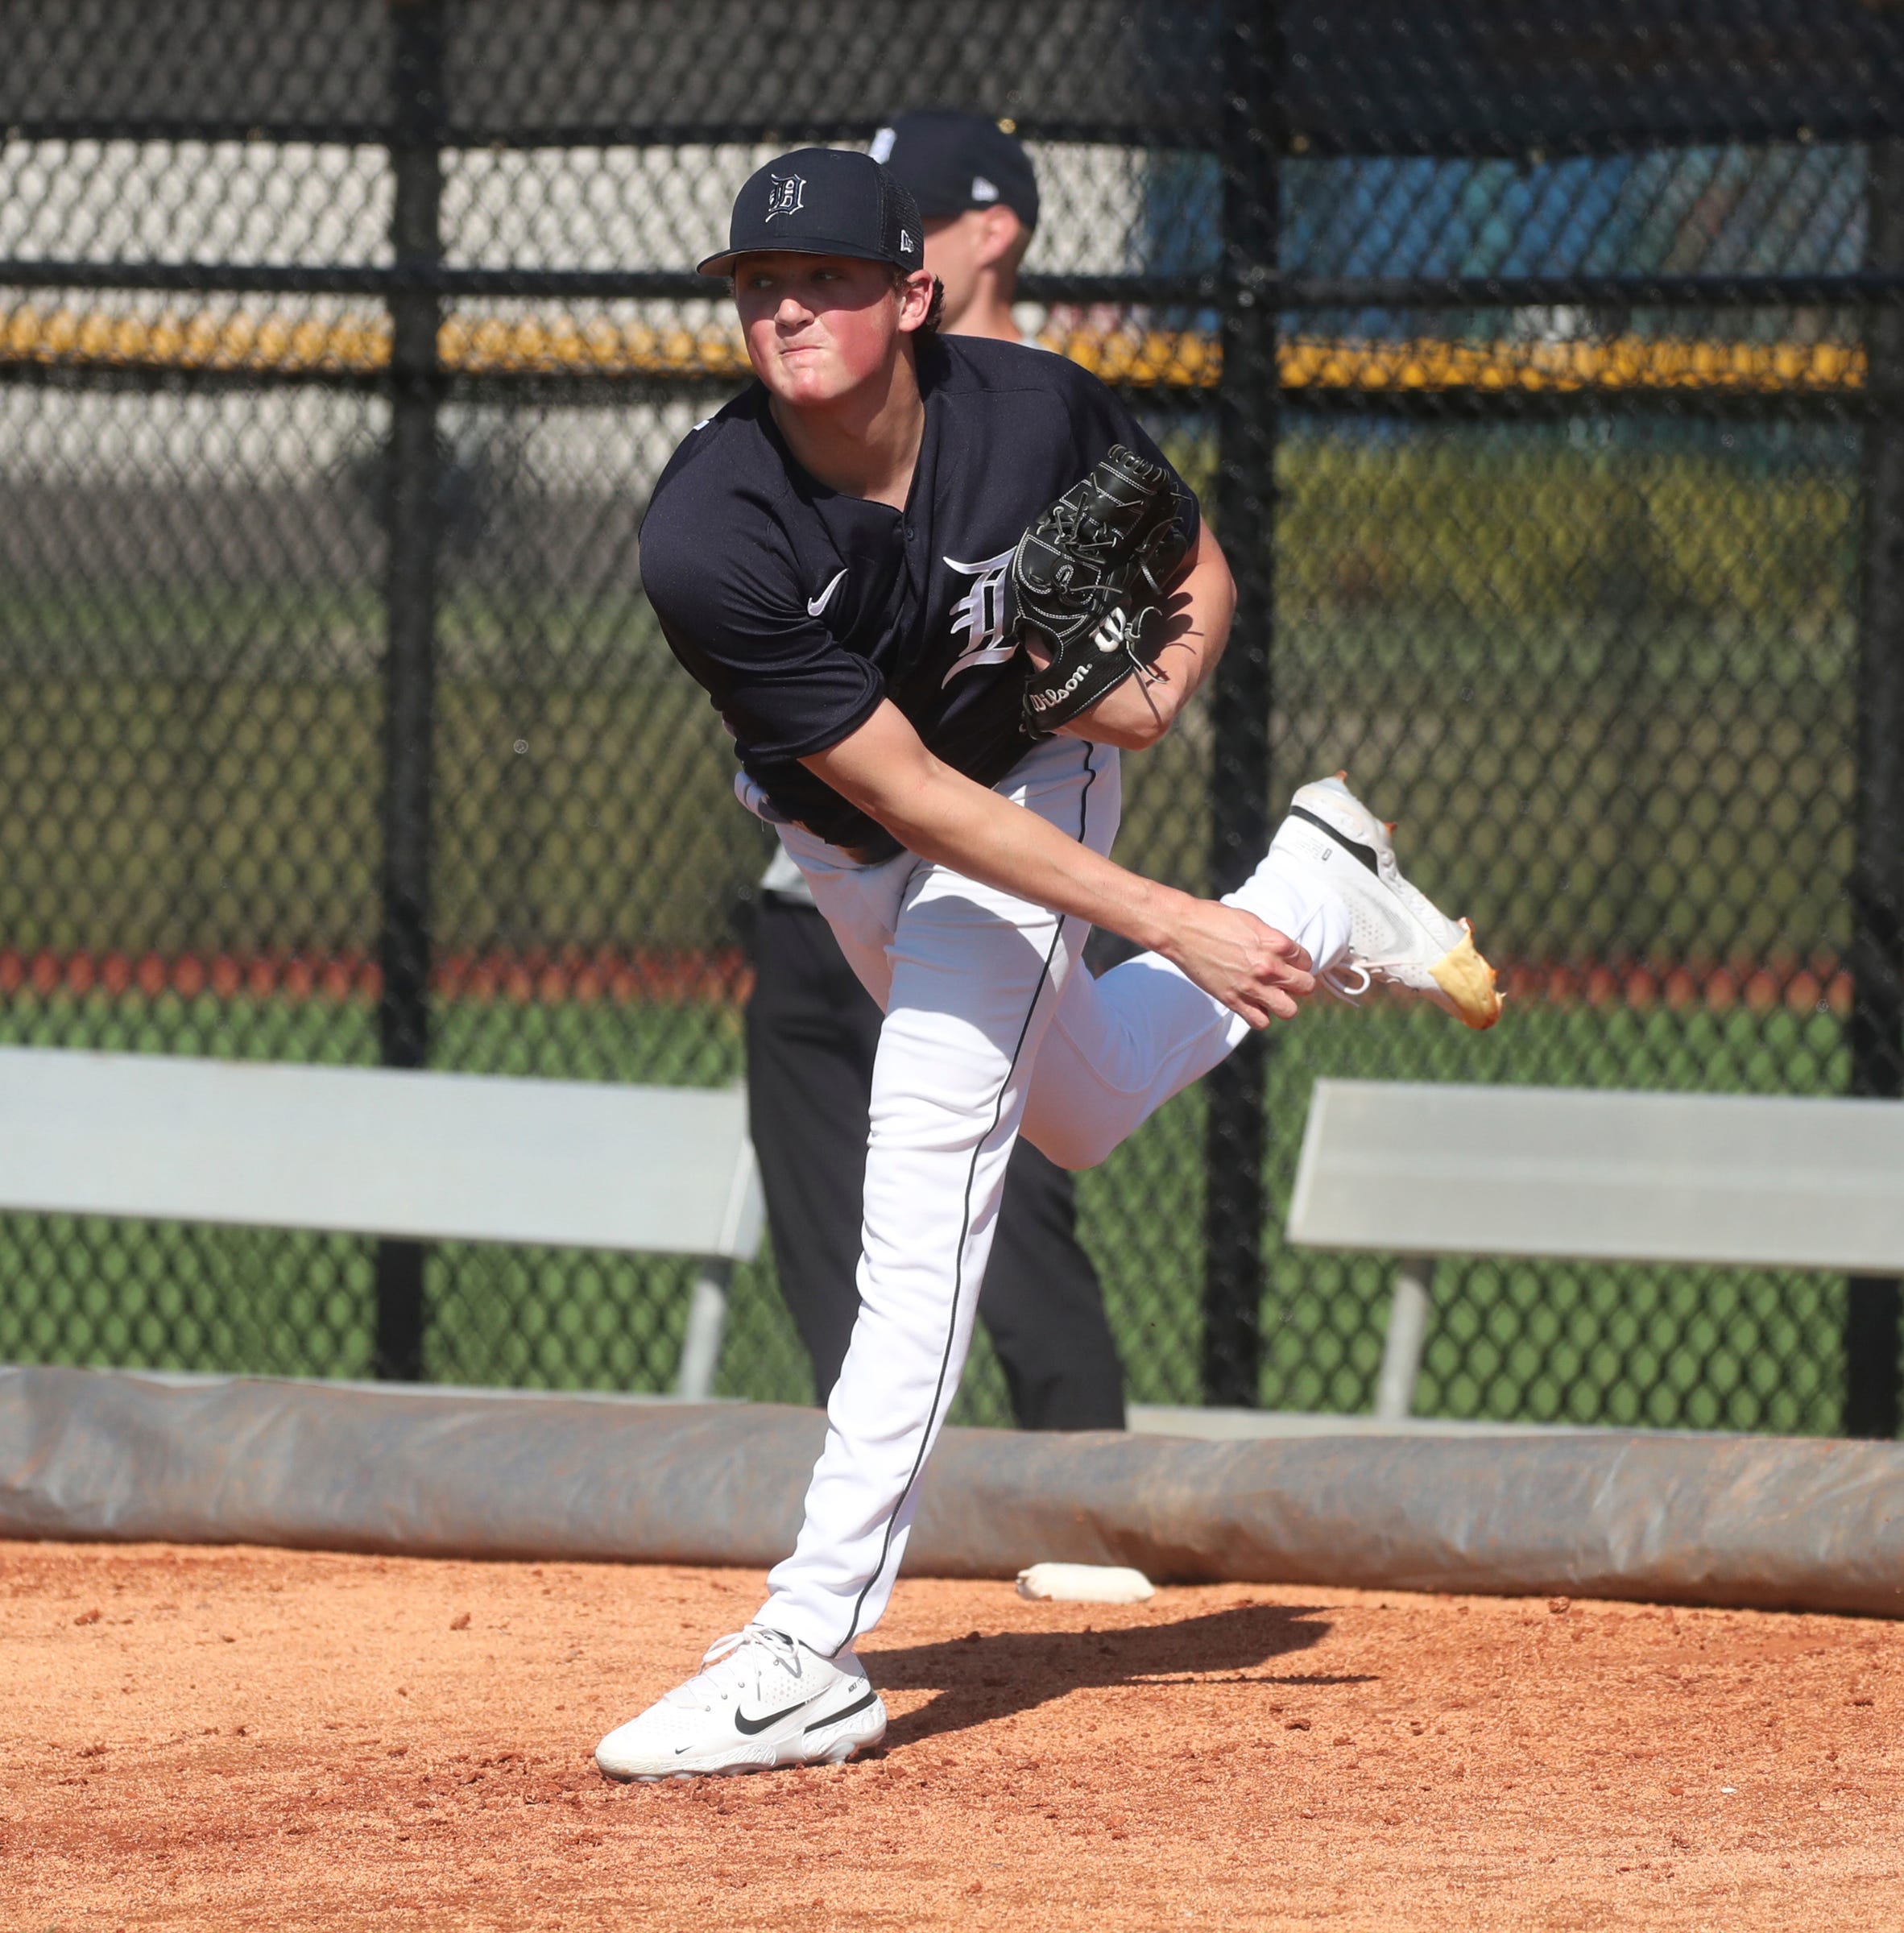
Reese Olson’s numbers suggest a spot in the rotation.
Tarik Skubal, Kenta Maeda, Jack Flaherty. Those are the names we hear repeatedly as being the guarantees to rotation in the Detroit Tigers rotation. The final two spots have been up for debate. Does Casey Mize knock the rust off by going to Toledo first? Can Matt Manning stay healthy?
The real question I’m asking is why is Reese Olson not a shoo-in?
The issues
The largest issue with Olson, and it’s not new, is his propensity to give up home runs. Again as a starter, his 1.37 HR/9 was fifth out of nine starters, but his 16.1% HR/FB rate was worst. To put it more into context — his HR/FB rate was 24th highest out of 127 starters who logged 90+ innings as a starter last year, though his HR/9 was more in the middle of the pack. Not ideal, not what you’d like to see. However, and we must remember, he did this as a rookie. If we narrow down to see only rookies with 90+ IP as a starter he’s basically a middle of the pack starter in a majority of stats. Certainly nothing otherworldly.
The Defense
Reese Olson made 21 appearances for the Tigers, starting in 18 of those games. He recorded the fourth-highest innings pitched (IP) on the team with 103.2, trailing only Eduardo Rodriguez, Michael Lorenzen (both no longer with the Tigers), and Joey Wentz. Among Tigers starters with at least 30 innings, Olson’s strikeout rate (K%) of 25.1% and his strikeout-to-walk ratio (K%-BB%) of 16.9% ranked second only to Tarik Skubal.
In his final five starts of the season, beginning Sept. 1, Olson pitched 31.1 innings. His home run rate per nine innings (HR/9) of 0.86 was nearly 40% lower than his season total, placing him in the top half, and near the top third, of all starters with more than 20 innings pitched during that period. This improvement coincided with a decrease in his home run-to-fly ball ratio (HR/FB%) to 12.5% and an increase in his ground ball percentage (GB%) to 46.8%. These changes occurred despite a 3% drop in his strikeout rate.
But let’s also look at his RV/100 by month by grouped pitch type:
|
Pitch type |
Fastballs |
Breaking balls |
Offspeed |
|
June |
0.1 |
0.5 |
-0.3 |
|
July |
-1.3 |
1.3 |
0.5 |
|
Aug |
0.9 |
0.1 |
-2.7 |
|
Sep/Oct |
2.2 |
1.4 |
1.1 |
It would seem that despite the Ks not being there those final 5 starts, each group of pitches were the most effective they had been and except for his breaking balls, all of them were significantly better. Also, in every month except for the Sept/Oct, he had at least one grouping that just wasn’t quite right.
This would indicate that something clicked in that final third of his innings, something that could be built upon.
What changed for Reese Olson?
Something that improved was his sequencing changes. Let’s look at this chart that breaks his season to pitches before 9/1 and again after, when he seemed to improve:
|
Pitch thrown |
Next pitch |
Count before 9/1 |
Count after 9/1 |
||
|
4S |
4S |
135 |
33.5% |
28 |
31.1% |
|
4S |
CH |
48 |
11.9% |
13 |
14.4% |
|
4S |
CB |
40 |
9.9% |
10 |
11.1% |
|
4S |
SI |
58 |
14.4% |
8 |
8.9% |
|
4S |
SL |
122 |
30.3% |
31 |
34.4% |
|
CH |
4S |
66 |
35.1% |
25 |
35.2% |
|
CH |
CH |
34 |
18.1% |
14 |
19.7% |
|
CH |
CB |
3 |
1.6% |
3 |
4.2% |
|
CH |
SI |
33 |
17.6% |
12 |
16.9% |
|
CH |
SL |
52 |
27.7% |
17 |
23.9% |
|
CB |
4S |
21 |
30.0% |
5 |
20.8% |
|
CB |
CH |
23 |
32.9% |
7 |
29.2% |
|
CB |
CB |
5 |
7.1% |
3 |
12.5% |
|
CB |
SI |
3 |
4.3% |
4 |
16.7% |
|
CB |
SL |
18 |
25.7% |
5 |
20.8% |
|
SI |
4S |
57 |
21.2% |
6 |
9.1% |
|
SI |
CH |
32 |
11.9% |
15 |
22.7% |
|
SI |
CB |
10 |
3.7% |
4 |
6.1% |
|
SI |
SI |
66 |
24.5% |
19 |
28.8% |
|
SI |
SL |
104 |
38.7% |
22 |
33.3% |
|
SL |
4S |
107 |
25.2% |
20 |
21.7% |
|
SL |
CH |
64 |
15.1% |
24 |
26.1% |
|
SL |
CB |
17 |
4.0% |
3 |
3.3% |
|
SL |
SI |
93 |
21.9% |
27 |
29.3% |
|
SL |
SL |
143 |
33.7% |
18 |
19.6% |
This chart here shows how many times two pitches appeared in his sequencing back-to-back. This doesn’t factor in the location of the pitches, only what they were. Immediately we can see that he stopped throwing his 4S right after his sinker and curveball by a significant amount. He also predominately threw his changeup or sinker right after throwing his slider, while lowering his slider-slider usage quite a bit. His slider was his second pitch less often in every case, except after his 4S from 9/1 on. It’s likely not the only change he has made, but it’s certainly one explanation to his increase in production that was noticed.
Conclusion
I, along with many, saw a reliever role for Reese Olson initially. Last season has for sure changed my mine and the final 5 starts really were encouraging for me. I don’t know what his ceiling is; I hope that he gets a shot to prove that he is the real deal and will get better.
He’s been getting better since we got him and with the people we have on the training side I expect him to get much better. He’s a Tiger!!!!!
I hear ya, Peter.
Let’s go boys!
Give us a season we can both remember and treasure.